![Group or Ungroup Rows and Columns in Excel Using Python [Advanced Guide]](https://cdn.hashnode.com/res/hashnode/image/upload/v1736752416846/85dd8f80-7ae6-4f7a-b0e5-0606c5e77d41.png?w=1600&h=840&fit=crop&crop=entropy&auto=compress,format&format=webp)


Managing large datasets in Excel can be overwhelming, especially with thousands of rows and columns. Navigating endless data takes time and effort. What if you could easily group related rows or columns for better organization? Whether you're working on financial reports, project timelines, or large-scale analysis, grouping and ungrouping data can save you time. In this guide, we’ll show you how to group or ungroup rows and columns in Excel using Python, making Excel data management quicker and more efficient. Let’s get started!
Python Library to Gourp or Ungroup Rows and Columns in Excel
To automate Excel grouping and ungrouping in Python more easily, it is recommended to use some Python Excel libraries, such as Spire.XLS for Python, Pandas, OpenPyX, Aspose.Cells for Python via Java, and so on. Because of the intuitive APIs and timely technical support, we take Spire.XLS for Python as an example to illustrate how to group or ungroup rows and columns in Excel files.
You can install it using the following pip command: pip install Spire.Presentation.
Group Rows and Columns in Excel Using Python
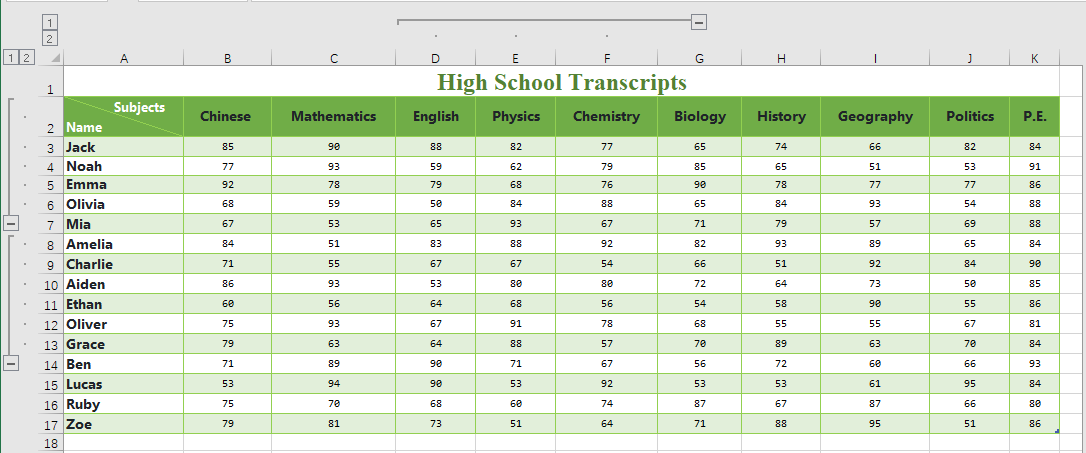
Grouping rows and columns in an Excel file helps you present data in a more organized and hierarchical way. For instance, in financial reports, you can group by categories, hide subcategories, and display only summary data. With the help of Spire.XLS for Python, this task becomes simple and can be completed in three main steps using the Worksheet.GroupByRows() and Worksheet.GroupByColumns() methods.
Steps to group rows and columns in Excel spreadsheets:
Create an object of the Workbook class, and load an Excel file using the Workbook.LoadFromFile() method.
Get a worksheet through the Workbook.Worksheets[] property.
Group rows in the worksheet with the Worksheet.GroupByRows() method. Group columns with the Worksheet.GroupByColumns() method.
Save the modified Excel workbook through the Workbook.SaveToFile() method.
The following code example demonstrates how to group rows 2 to 6, rows 8 to 13, and columns 4 to 6 in the first worksheet of an Excel file:
from spire.xls import *
from spire.xls.common import *


# Create a Workbook object
workbook = Workbook()

# Load a sample Excel file
workbook.LoadFromFile("/sample.xlsx")

# Get the first worksheet
sheet = workbook.Worksheets[0]

# Group rows
sheet.GroupByRows(2, 6, False)
sheet.GroupByRows(8, 13, False)

# Group columns
sheet.GroupByColumns(4, 6, False)

# Save the result file
workbook.SaveToFile("/GroupRowsAndColumns.xlsx", ExcelVersion.Version2016)
workbook.Dispose()
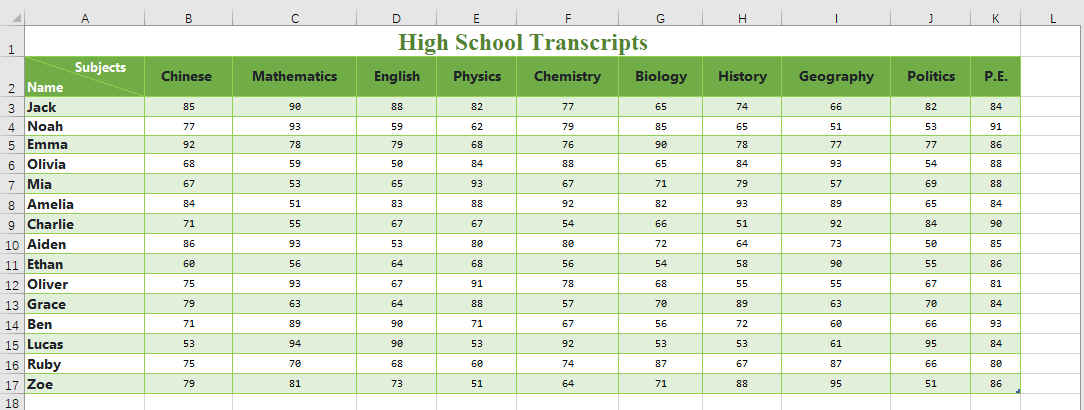
How to Automate Excel Ungrouping in Python
Ungrouping rows and columns in Excel is similar to the grouping process, but instead, you use the Worksheet.UngroupByRows() and Worksheet.UngroupByColumns() methods. These methods allow you to quickly ungroup the rows and columns, revealing the complete data. Additionally, ungrouping simplifies the process of working with individual rows or columns. Let’s dive deeper into how this works!
Steps to ungroup rows and columns in Excel worksheets:
Create an instance of the Workbook class, and read an Excel spreadsheet from the file path through the Workbook.LoadFromFile() method.
Retrieve a worksheet using the Workbook.Worksheets[] property.
Ungroup rows in the worksheet with the Worksheet.UngroupByRows() method, and ungroup columns through the Worksheet.UngroupByColumns() method.
Save the updated Excel file.
The example below shows how to ungroup rows 2 to 6, rows 8 to 13, and columns 4 to 6 in the first worksheet of an Excel file:
from spire.xls import *
from spire.xls.common import *


# Create a Workbook object
workbook = Workbook()

# Load a sample Excel file
workbook.LoadFromFile("/GroupRowsAndColumns.xlsx")

# Get the first worksheet
sheet = workbook.Worksheets[0]

# UnGroup rows
sheet.UngroupByRows(2, 6)
sheet.UngroupByRows(8, 13)

# UnGroup columns
sheet.UngroupByColumns(4, 6)

# Save the result file
workbook.SaveToFile("/UngroupRowsAndColumns.xlsx", ExcelVersion.Version2016)
workbook.Dispose()
Expand or Collapse Groups in Excel in Python
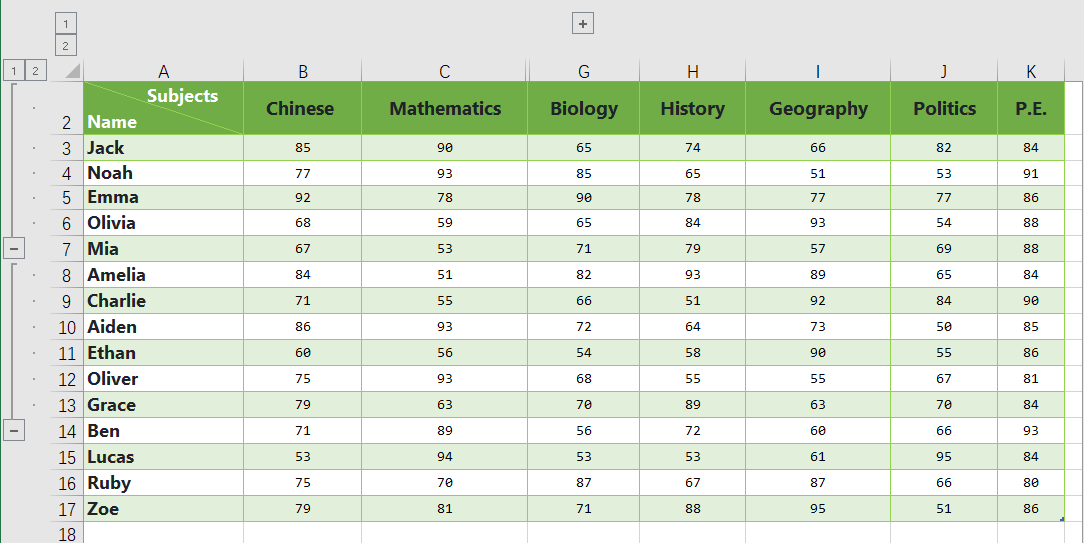
Grouping rows and columns allows you to expand or collapse sections, making it easier to read, manage, and analyze specific data within a table. Using Python to achieve this is straightforward, with key methods like Worksheet.Range[].ExpandGroup() and Worksheet.Range[].CollapseGroup() for expanding and collapsing rows or columns. Let’s walk through the detailed steps to do this!
Steps to expand or collapse groups in Excel:
Create a Workbook object, and specify the file path of the source Excel file with the Workbook.LoadFromFile() method.
Retrieve a worksheet through the Workbook.Worksheets[] property.
Expand a group using the Worksheet.Range[].ExpandGroup() method, and collapse a group using the Worksheet.Range[].CollapseGroup() method.
Save the modified Excel workbook as a new file.
The following code demonstrates expanding the range from A2 to G6 and hiding the range from D1 to F15:
from spire.xls import *
from spire.xls.common import *


# Create a Workbook object
workbook = Workbook()

# Load a sample Excel file
workbook.LoadFromFile("/GroupRowsAndColumns.xlsx")

# Get the first worksheet
sheet = workbook.Worksheets[0]

# Expand a group
sheet.Range["A2:G6"].ExpandGroup(GroupByType.ByRows)

# Collapse a group
sheet.Range["D1:F15"].CollapseGroup(GroupByType.ByColumns)

# Save the result file
workbook.SaveToFile("/ExpandCollapseRowsAndColumns.xlsx", ExcelVersion.Version2016)
workbook.Dispose()
The Bottom Line
This guide explains how to group and ungroup rows and columns in Excel using Python, with additional coverage on expanding and collapsing grouped ranges. The article includes detailed steps and code examples to help you get started. By the end, you’ll see how easy and fast it is to automate Excel grouping and ungrouping with Python!